
Big data holds an immense amount of value for smart home brands, and can usually give you insights into aspects of your business that you might not be able to find elsewhere.
In the first part of this series, we explored what big data really is—and how you can find valuable information in your support calls. And here in part two, we’re going to start putting that information to work by investigating how big data can help smart home brands reduce product returns.
The high cost of product returns.
Many smart home brands offer a generous return policy that doesn’t charge consumers for the return of their devices which means that many of these costs end up falling back on the brand to cover. And it’s not insignificant; just last year, the National Retail Federation (NRF) shared an estimate that overall online returns accounted for approximately $106 million for every $1 billion in retail sales.
Consider this: Statista found that consumers will spend approximately $134 billion on smart home devices in 2022. This means that based on the NRF’s estimate, product returns will cost smart home brands up to $14.2 billion this year.
In 2022 alone, smart home brands will spend up to $14.2 billion on product returns.
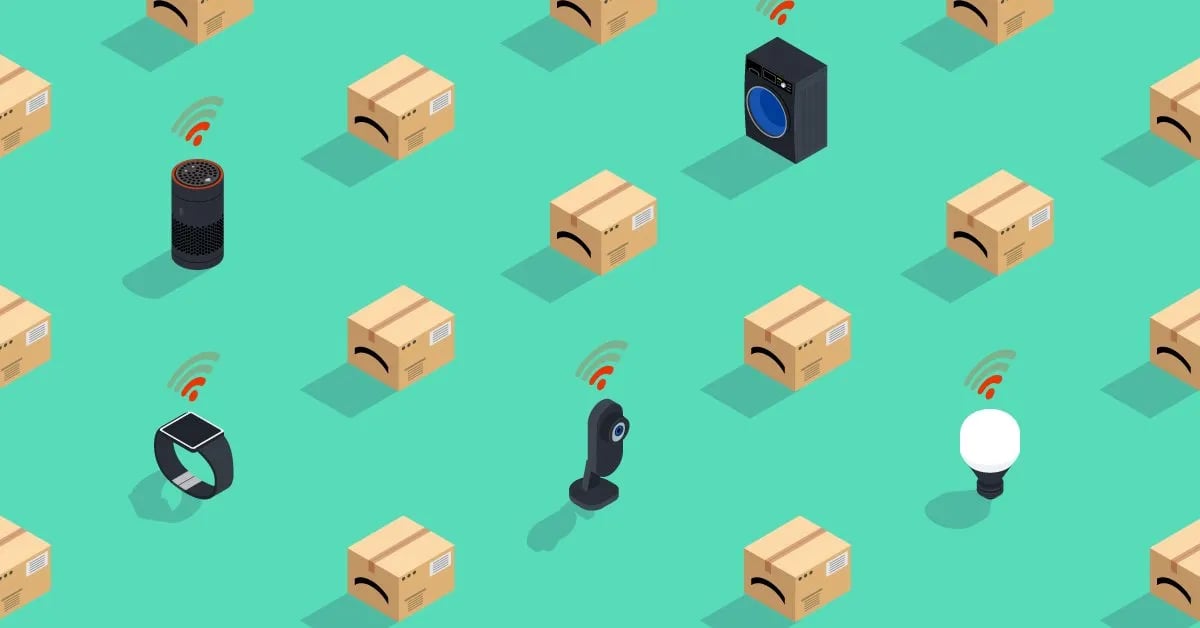
According to recent data from Parks Associates, the biggest issue consumers run into with devices is WiFi connectivity. Smart home brands have zero control over this variable in their device’s performance, and will typically end up spending far more than they need to both on troubleshooting and ultimately on RMAs for what could be a no-fault-found issue.
How to use big data to reduce product returns
Make sure you’re collecting the right information.
Chances are, if you’ve been providing support for your customers for any length of time, you’ve already got the start of a big data repository. After all, many of the data points that end up being useful come from the various interactions you’ll have with your customers, especially support calls and return records.
So what data should you collect? You could take a few different approaches, but good places to start here are your call center records, resolved case details, and reasons for returns.
Important: Make sure you’re adhering to any privacy regulations that may apply to your business and your customers!
Look for trends in your data.
Once you know what you’re monitoring, the next step is understanding what the data is telling you. A common practice in retail sales is analyzing the data around product returns to identify trends in those returns. Here are a couple of trends you can keep an eye on to help reduce product returns:
- Tracking return reason against post-return product state. In other words, for each category of return reasons, in what state was the returned product? Was it a no-fault-found situation or was the device actually defective? Having this information can help you identify the most common reasons for normally-functioning product returns.
- Reported issue vs the actual root cause. By tracking tickets successfully resolved by your team, you can identify the variance between reported issues and root causes. This information can provide insights you can take to your product development team, so they can improve on the next iteration. It can also be shared with your support team so they can develop educational materials that can be provided to consumers to help identify real root causes (instead of theorized ones), resolve the issues, and keep those devices in homes.
You can also use the data to identify trends in consumer interests, functionality, and network limitations and interoperability.
Look to your data for answers - not just information.
The true power of big data isn’t that it gives you information; it’s that it can give you answers. It provides direct insight into what’s going on, which gives you what you need to create and adapt business strategies in an informed manner.